🚀 Welcome to TrendBloom – Where Innovation Meets Opportunity! 🌱

Automation

Discover top AI tools shaping business automation in 2025.

A person is interacting with a smartphone displaying financial data, while a laptop in the background shows various stock market indices. The hand is using a finger to navigate the smartphone. Both screens are filled with numbers and graphs related to market information, with the laptop displaying line charts.
A person is holding a smartphone displaying a financial trading app. The screen shows a candlestick chart with various trading metrics, including the current price, percentage changes, and buttons for different actions. The person's hands are visible, and a black background accentuates the smartphone screen.
A person holding a smartphone with a financial application open on the screen, standing outside a modern glass building. The background shows a plaza with trees and pedestrians.
A person is using a smartphone to view a financial market chart. The screen displays a candlestick chart with green and red bars, likely indicating cryptocurrency or stock prices. The person appears to be seated, wearing casual clothes like shorts and holding the phone in both hands.
A close-up view of a smartphone screen displaying stock market information. The screen shows stock symbols such as BA and BRK-B, along with company names like The Boeing Company and Berkshire Hathaway. There are also green and red charts alongside figures indicating stock performance.

Contact Us

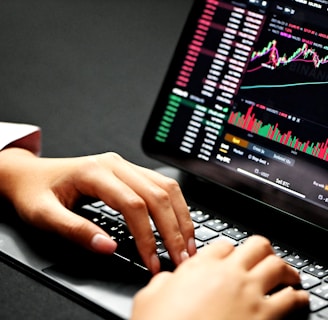
Hands typing on a laptop keyboard with a screen displaying financial graphs and stock market data. Multiple charts and numbers are visible, indicating online trading or financial analysis.

Reach out for inquiries on AI, sustainability, and personal finance content ideas and collaborations.